By FAY REN
The rally in equity markets has extended into June, having recovered substantially from the depth of the March sell-off
The global equity index is -6.3% from its peak and the S&P 500 -5.4%, whilst the NASDAQ index has made new all-time highs. Despite the deepest economic downturn since the Great Depression, a dislocation between financial markets and economies has opened up as governments’ blend of monetary and fiscal policy initiatives has underpinned prices.
Markets were highly discerning in the initial sell-off, less so since. In the initial phase, they rewarded visibility and stability and punished the opposite. Cross sectional return dispersion in different markets spiked, and volatility of price moves reached the highs recorded in the Global Financial Crisis of 2008 before easing in the second quarter. The concentration of performance in two sectors – Tech & Health Care – gave rise to extreme narrow market breadth, with the median company in the S&P 500 still underperforming the index by 15.7% year to date as at the end of May.
Defensive quality companies that offer investors consolation in the form of revenue growth, profit retention, and financial resilience in their balance sheets and cashflows outperformed the market during this period. This is the continuation of a trend that began long before the pandemic. Relative performance between high/low ROE and high/low leverage (Debt/EV) companies illustrates this:
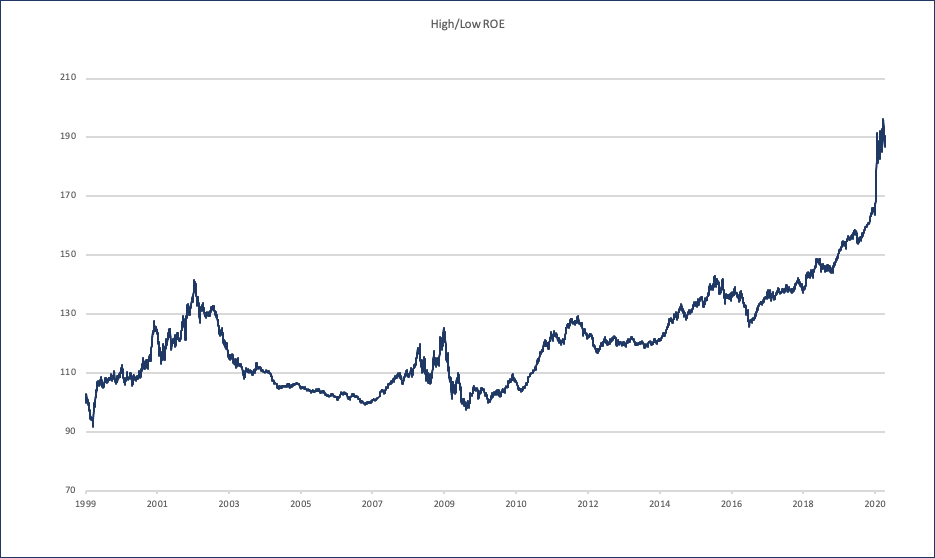
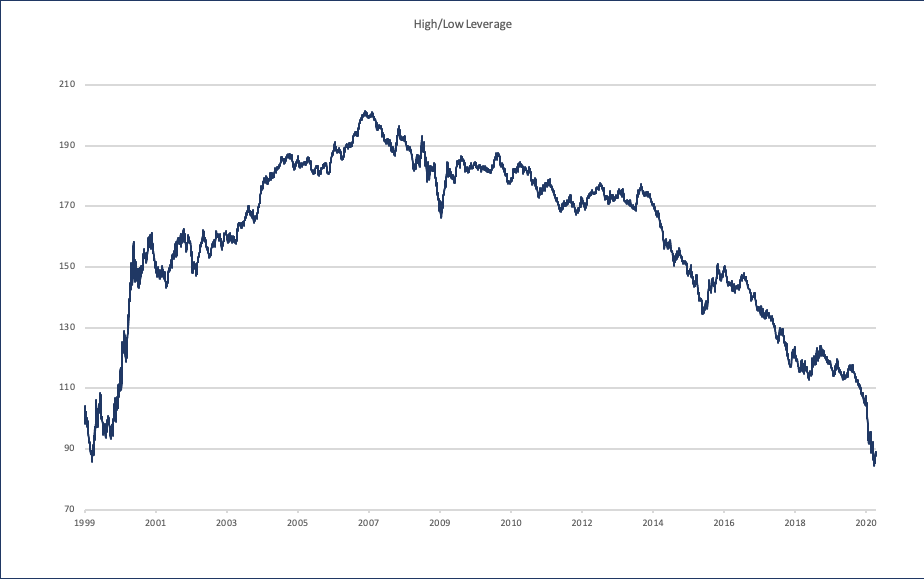
Cash rich Tech giants encapsulate all of these factors, most of them listed in the US. Healthcare also escaped relatively unscathed, for the critical role it played in this pandemic. The companies that can maintain growth and profitability tend to consolidate more market share and emerge on the other side of the crisis in a stronger position, particularly in an environment where high quality growth assets are becoming increasingly scarce.
Low cash companies, on the other hand, suffered. As companies race to build-up their war chests, hoarding cash through new issuances (US$1.1 trillion raised YTD), buyback and dividend cut/suspensions, debt issuers, high yielding and low dividend cover styles have come under pressure.
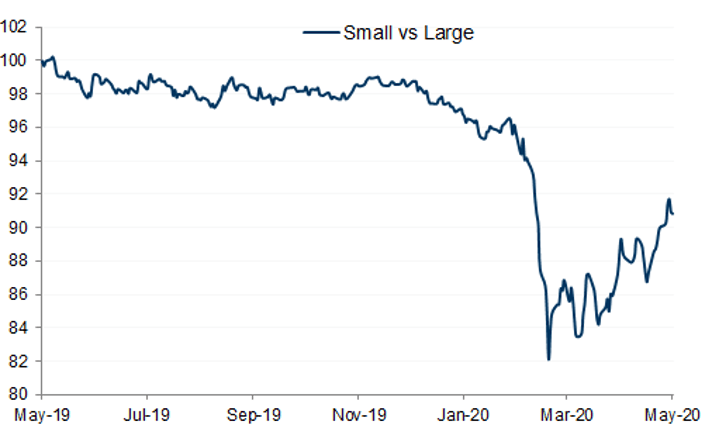
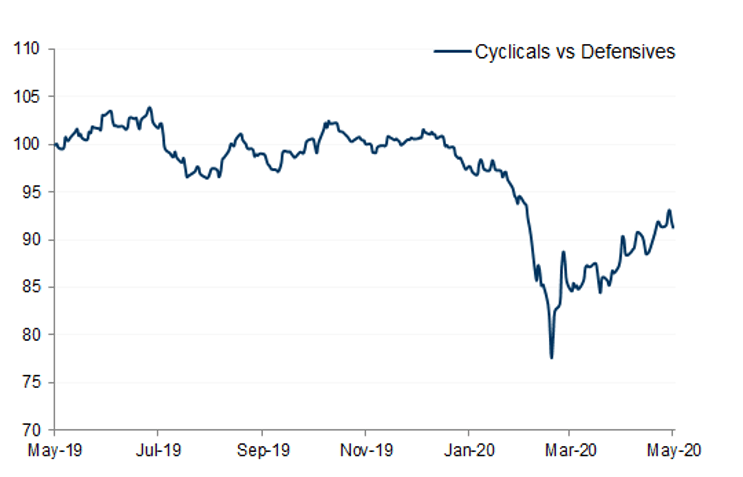
However, as countries begin to re-open around the world, optimism is also starting to creep in. In April and May, we observed a trend rotation where laggard styles including domestically exposed small caps have become the best performing style as investor risk appetite returned. Cyclical and value stocks (to a lesser extent) that were initially hard hit also rebounded sharply on improving economic data, particularly in US employment. The top performing sectors QTD outside technology are: Consumer Discretionary (+23.8%), Energy (+19.5%) and Materials (+19.4%) in US Dollar terms.
The style rotation is illustrated by the inflection in relative performance in the charts below:
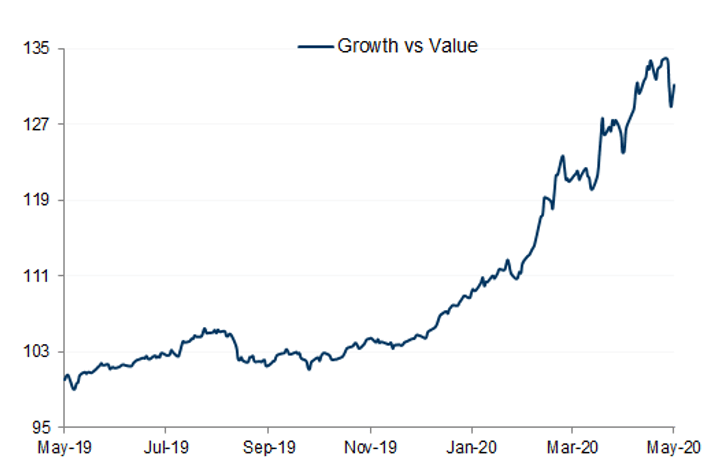
How long these trends persist remains in question. In the near-term, earnings estimates are likely to continue to drift lower and uncertainties with the status of the virus and vaccine provision. S&P 500 Return On Equity has fallen to 16.4% in Q1, the lowest level since 2017, driven by a deterioration in corporate margins.
The value versus growth debate has returned. The valuation spread between value and growth styles is at the widest level since the Tech Bubble (exceeding 2 standard deviations above 20 year average for World Equities). The latter has been outperforming for many years, arguing for a reversal. That being said the value/growth relationship has been complicated by the disruption effect of technology through many business models classified as ‘value’. Mean reversion, the bedrock of the value approach, may not be in the future of those companies assailed by novel business models. The possibility of inflation may be a potential catalyst for value and is perhaps necessary to reduce the real burden of new debt accrued by governments.
Notably, the area where rotation has not occurred is in the consistent outperformance of strong balance sheet companies, which remains the best performing style this year. In times of stress and earnings uncertainty, balance sheet strength provides a helpful buffer to alleviate immediate existential risks. Financially sound companies also have the capacity to invest and expand their businesses countercyclically, the recent M&A spree in big tech (e.g. Facebook/Jio, Amazon/Zoox) demonstrates this. As more companies raise debt to see through this difficult period, overall debt levels will be higher as a result, and stronger balance sheet companies will continue to prosper.
We make the following observations by way of conclusion: 1) Style trends can remain entrenched for prolonged periods making any strategy which attempts to time reversal in these trends dangerous. 2) Periods of market stress often coincide with change in the short term relative performance of styles, for example in small caps and cyclical businesses or those carrying a heavy debt burden in challenged industries, for example Integrated Oil companies. The long term outcome for these will be driven by actions taken at the corporate level rather than the markets style preference. 3) The long term investor will be best served by a strategy which aligns style tilts with sound corporate practices such as ensuring the return from business activities exceeds cost of capital and financing of the business allows for long term strategic decision making. 4) The short term investor seeking to time style cycles will provide fantastic entertainment.


