

By ION SIORAS

& OSCAR MACKERETH
In this report, we address the longer-term buffers of the companies held in the portfolio.
Introduction
Portfolio losses such as we have seen this year will be recovered. The more destructive form of loss is permanent write off of capital of a portion of the portfolio in relation to one or more of its constituent companies. The instances in which this could take place would be if a company fails. This article addresses the buffers that exist by virtue of the investment process of the strategy.
Balance sheets and financial health
One of the core requirements for a company to be considered for, or indeed enter, the Global Leaders portfolio is financial robustness. The concept of financial strength is to a degree contextual. Some business models naturally admit or even require more debt for optimal operation. There is however an underlying principle, supported by a litany of cautionary cases, that excessive leverage endangers otherwise sound companies during periods of economic difficulty.
It can be tempting during periods of expanding equity prices to allow some laxity to creep in to the assessment of balance sheet health. An established company firing on all cylinders may seem impervious to financial distress. Similarly, a business model hitting the on-ramp of super-normal growth may appear to be outgrowing its debt load tangibly.
We believe that remaining vigilant on selecting companies with sustainable and conservative financing arrangements provides a buffer to an investment case, often when it is needed most. This is necessitated by the fact that equity holders in a company sit subordinate to debtors of all seniorities in the capital structure.
The vagaries of valuation can cause short to medium term volatility in the value of a company, but it is financial distress or bankruptcy that are the culprits for serious and often permanent capital impairment in equity investing.
Tenets of the approach
A number of metrics are used to assess the financial viability of the existing Global Leaders companies and candidate companies under examination.
We start from the simple ‘rule of thumb’ measures that sense check any business, big or small. A measure of the net debt versus the company’s earning capacity, and thus capacity to service said debt. The rough measure favoured by most practitioners here is ‘net debt to EBITDA (Earnings before Interest, Tax, Debt and Amortisation)’. Although EBITDA is not the true cash generation of a company, it is a standardised earnings stream in accounting terms that can be compared across companies and through time.
On this measure the average and median Global Leader company scores a 1.1x. What this implies is that if EBITDA was indeed the final earnings stream, it would take just over a year for the average Global Leader company to cover its net debt exposure.
A more rigorous measure would compare net debt to free cash flow attributable to the company. Ultimately it is unencumbered cash that can actually be deployed to both service and pay down debt. On this metric both the median and the average for the portfolio are below 1 year, at 0.7x and 0.8x.
“Net debt to EBITDA” and “net debt to equity” measures of the portfolio can be argued to be flattered by the number of net cash balance sheet companies in the portfolio. 40% of the Global Leaders portfolio is constituted by companies where cash on the balance sheet exceeds debt.
If we exclude net cash companies from our analysis, the average net debt to EBITDA ratio rises to 1.9x and the average net debt to free cash flow ratio reaches 2.6x. Thus even the more indebted companies in the portfolio could feasibly cover a tangible proportion of their net debt exposure within 12 – 24 months from free cash generation.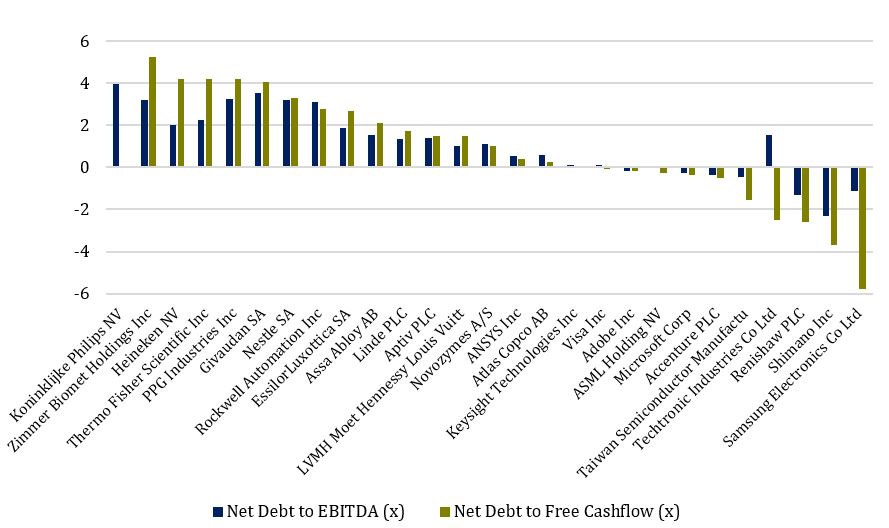
Turning to understanding a company’s credit position on a day to day basis, we can look to the interest coverage ratio. That is to say, the level of free cashflow available versus the interest costs paid on existing debt.
Taking an average of the last 5 financial years for each Global Leader company, the median company in the portfolio had an average interest coverage ratio of 20 times. Indeed over the 27 companies and 5 sampling points (135 readings in total) the interest coverage did not fall below 3x for any company other than Techtronics in the current year to date.
Given the rising interest rate environment, we think it prudent to stress interest repayment costs higher and assess coverage ratios. We assume a flat tripling of interest repayments across every company in the Global Leaders strategy, a strenuous assumption given that interest rate costs rise methodically rather than a step change as refinancings come due.
Under this higher interest regime, only 5 of the 27 Global Leaders companies fall to an interest to free cash flow ratio of below 3. The average and median remain at 31x and 10x covered respectively.
Other metrics can be considered to stress test for more dramatic scenarios. The traditional net debt to equity ratio reveals what cushion the equity portion of a company’s financing provides. In the most extreme case it can be used to understand the level of dilution current equity holders would sustain if a company was forced to de-lever. Permanent capital loss can occur when companies are forced to partially or wholly recapitalise.
At this point, we will elucidate our appreciation of balance sheet-based buffers with some portfolio examples.
Thermo Fisher Scientific
Thermo Fisher is a leader in the production of all the core inputs (instruments, reagents and consumables) for modern biopharmaceutical and life sciences research. A US domiciled but global company with a market capitalisation of US$206bn, Thermo Fisher sits on the more levered end of the Global Leaders portfolio.
Below we caption some metrics we have discussed (in US$ millions unless otherwise stated):
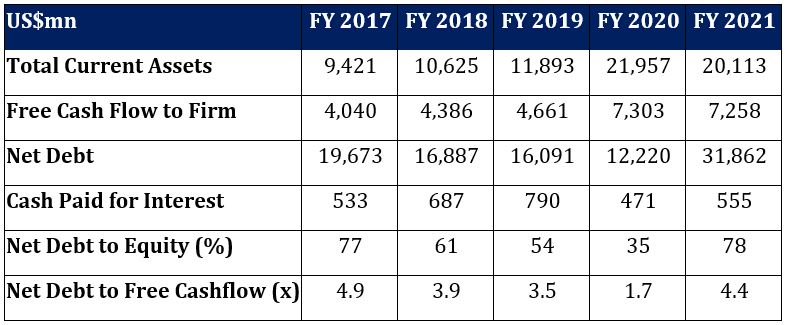
Thermo Fisher has a net debt to free cashflow in the 4x to 5x range over the last 5 years, with a spike in cash generated during the COVID-19 pandemic bringing this ratio down briefly. This is indeed on the high end but supported by the defensiveness of Thermo Fisher’s earning stream, underpinned by its broad product range with high in-built utility.
Operating in a less cyclical sector and providing mission critical devices and consumables has meant that Thermo Fisher’s revenue visibility remains high and earning variability low.
It is useful to also consider the markets assessment of Thermo Fisher’s creditworthiness. Company debt sits on the crossover between a high and medium investment grade credit (A- to BBB+) and the Thermo Fisher 2024 bonds (US$2.5bn issuance outstanding) yield 0.55% above the comparable US treasury bond.
In 2021, Thermo Fisher engaged in the acquisition of a company called PPD for US$17.4bn, deploying capital that had accumulated from the demand pull-forward of the COVID pandemic for Thermo Fisher products. This was both a signal of the management’s comfort to operate the firms balance sheet at the previous average level of debt and a demonstration of the opportunity to deploy capital for incremental growth, rather than return to shareholders.
The debt maturity for Thermo Fisher’s financing displays an adequate diversity. The debt load is spread across 32 bond issues with a weighted average maturity of 8.3 years or out to 2031. Interest servicing costs remain low at ~7% of cash flow with the coupons on issued debt averaging 1.6% on a weighted basis.
A refinancing schedule over the next few years in this materially higher interest rate environment should not cause undue burden to the company’s ongoing financial position. US$10bn of debt (30%) is due for refinancing by 2025.
Accenture
Accenture is the largest consulting company in the world by headcount and a leader in IT service consulting. A net cash balance sheet with US$7.9bn in cash versus US$3.3bn in debt makes Accenture one of the, but not the most, conservatively financed companies in the Global Leader portfolio.
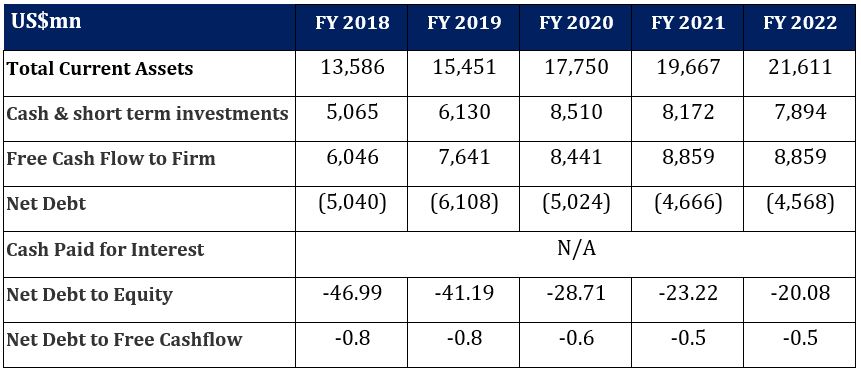
Nearly all of Accenture “debt” actually takes the form of deferred revenue, pension and lease liabilities. Pension and lease liabilities are to a large degree self-explanatory. Deferred revenue liabilities in Accenture’s business model broadly represent upfront payments for services yet to be rendered or rendered over time. Failure to do so would require a reimbursement by Accenture to relevant parties.
Given the above, there is no listed debt aggregate to speak of on which we can do an analysis similar to Thermo Fisher.
In closing, we also think there is a more optimistic reason to solve for balance sheet robustness in company selection. The flip side to over-levered companies facing distress and being forced to “sell the family silver” at the worst possible time is the optionality of dry powder in the same situations.
Conservatively levered companies with excess cash on the balance sheet can choose to take advantage of competitors weakness, either through isolated asset purchases or wholesale M&A.
Our Global Leader companies have a history of emerging stronger from the troughing of an economic cycle and the associated corporate deleveraging. We think this optionality will be particularly pertinent if we are at the foothills of a global recession as we enter 2023.
Margins
Margin ratios are used to consider the differential between the price at which a product is sold, and the costs associated with making or selling the product. They provide insights into an organisation’s ability to convert revenue into profit and are therefore a core variable in the examination of Global Leaders companies on both a standalone and comparative basis. This is done through three key metrics.
Firstly, the gross profit margin informs us of the profitability of an organisation after its cost of goods sold. This serves as a proxy for an organisation’s ability to effectively covert its raw materials into profit. A high gross margin leaves the organisation with excess capital for operational investment and returning cash flow to its shareholders.
Secondly, operating margins track the profit generated by the sale of products and services, before deducting interest and taxes. This serves as a rough measure of the ability of the organisation to service operating leverage and can be used to trace the growth of sales relative to overall expenses.
Finally, the net profit margin compares the net income of the business with revenue. It is the most representative of the efficiency of the business’s entire operations.
Through analysing a business’s margin profile, the investor can better forecast the organisation’s forward trajectory, positioning in economic cycle rotations, and impact of rising input costs. They are also a practical way of making sector assessments, due to their ratio structure allowing for comparisons across scale, geography, and currency.
What makes a Cerno Global Leader a leader
Superior margins are essential for the identification of sector leaders for the Global Leader portfolio. For example, Accenture and Capgemini, on a company description level, present comparable business profile. Both are leading multinational IT service and consulting companies, with large staff bases, significant geographical diversity, and deep sector expertise.
However, ratio analysis is one method of demonstrating Accenture’s superior operational efficiency. Accenture has gross, operating and net margins of 32.0%, 15.2% and 11.2% respectively, whilst Capgemini achieves margins of 26.3%, 10.4% and 6.9%.
This suggests that Accenture commands superior efficiencies within its profit conversion profile, relative to a key competitor, thereby commanding a greater ability to reinvest a greater portion of those revenues for future growth, recession protection, or return capital to its shareholders.
This same logic of peer comparison can be used to compare the margins of two portfolios with similar characteristics to assess the quality of the aggregate constituents. Thus, we have compared the Global Leaders’ margin profile to the Bloomberg World Large and Mid-Cap index.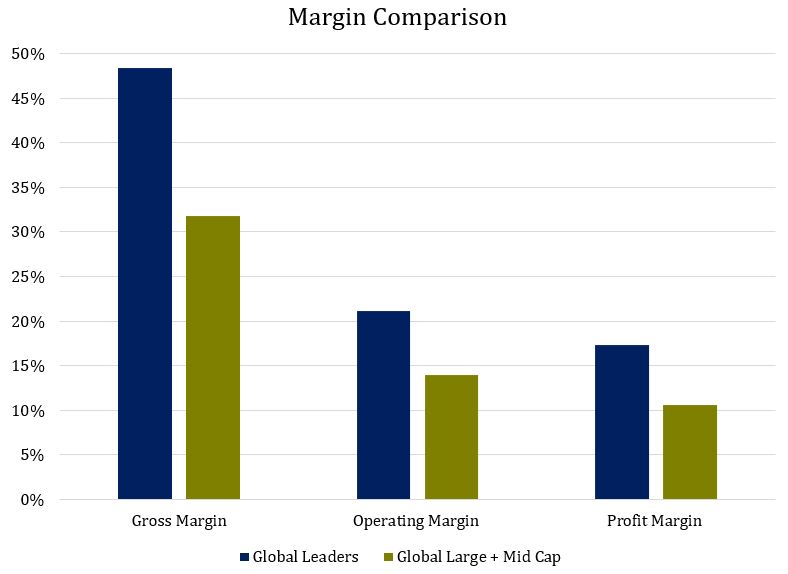
 The Global Leader constituents are, in aggregate, more effective than the average company at extracting profit from their revenues. This is apparent in their materially higher margins across the gross, operating, and net profit categories. However, a more nuanced corollary that emerges is that this margin of safety stands the selected companies well for more inclement economic conditions.
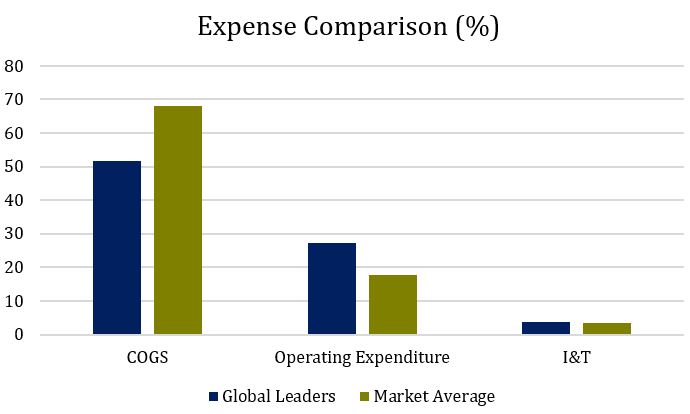
The gross margin of the Global Leaders’ portfolio is 15 percentage points above that of the global aggregate. This implies the use of their leading positions to leverage scale-based synergies and pricing power, thereby reducing the average cost of goods sold (COGS), to 18 percentage points lower than their counterparts.
The benefit of this is twofold. Firstly, it allows a greater margin of safety in periods of revenue depletion or COGS inflation, whilst also suggesting a greater ability to defend margins against pressures via pricing power or product adjustment. Secondly, lower COGS expenses also facilitate greater investment into corporate infrastructure, which supports workforce development, balance sheet strength and R&D spending, all of which are essential in preparation for growth or recessions.
This is evident in the proportionally larger operating expense of the Global Leaders portfolio, which is also 52% higher than global average. Operating expenses consist of a mixture of fixed and variable costs. It may be a disadvantage for a business to have a higher proportion of fixed costs, as they will not reduce in tandem with output in periods of lower demand, resulting in margin compression. However, a key process in Cerno’s framework is the evaluation of management’s quality and capital management. This process tends to alight on businesses with lower capital intensity which prioritise investment into growth and balance sheet strength.
This can be seen through an analysis of Accenture and TSMC. In 2021, Accenture’s cost base runs to US$43bn. 80% in Cost of Services, 12% in Sales & Marketing and 8% in the form of fixed general and administrative costs. The largest segment, Cost of Services, refers to a variety of activities such as recruiting and training, software development and integration of acquisitions.
On the other hand, TSMC’s 2021 operating expenses came to TWD169bn, with 21.8% coming from General & Administrative expenses, and 73.7% and 4.5% coming from the variable R&D and Marketing expenses respectively. Thus, whilst the operating expenses are relatively higher than their global average counterparts, we can see a prioritisation of investment into operational development and growth technologies, with evidence of measured capital deployment.
This approach is fundamental to the operational successes of the Global Leader’s portfolio. Regular investments into new technologies and services, workforce development and organisational infrastructure allow these companies to prepare for unexpected events and various macro-economic environments. Moreover, as variable expenses, they also present costs which can be adjusted in response to macroeconomic environments which may present changes in liquidity conditions or lower revenue generation.
Diversification
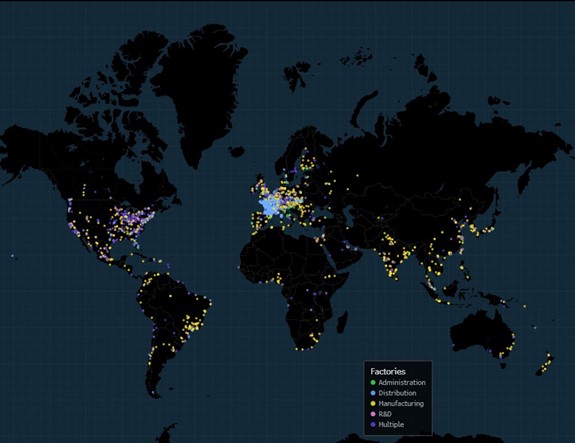
Figure 1: Global Leaders Facility Map
Using 10 year monthly rolling data, the average measured correlation between any two Global Leaders stocks is 48%, with a standard deviation of 21%. The lowest correlation in the portfolio can be found between Heineken and Shimano, with a correlation of -23%.
The heat map below shows the correlation relationships which exist across the portfolio, with the highest correlations mapped in red and the lowest in green.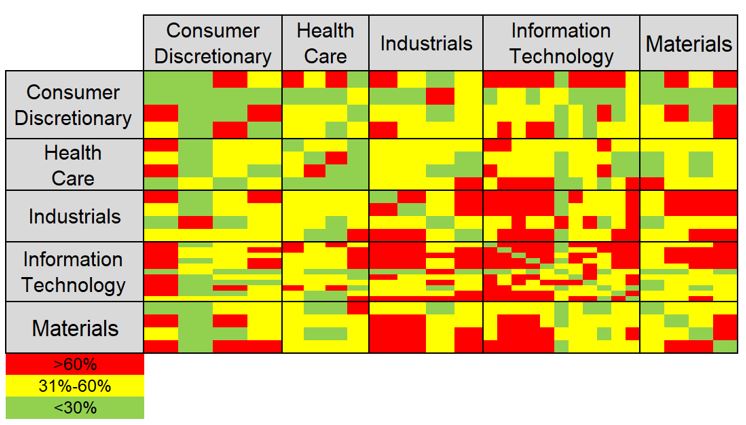 Financial theory tells us that the lower the correlation between assets, the greater dampening impact that inputting a security will have on the standard deviation (colloquially known volatility) of a portfolio as a whole. Thus, with the portfolio generally ranging between 25 and 30 securities, 68% of which have little to no correlation to each other, there is an expected range of 19-21 uncorrelated securities at any one time, providing satisfactory levels of diversification. This can also be considered observationally.
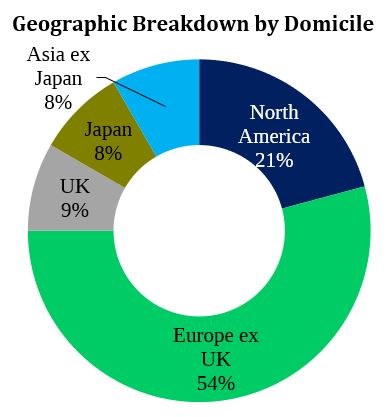
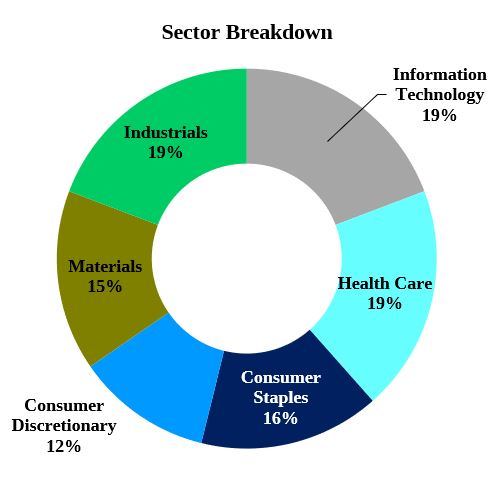
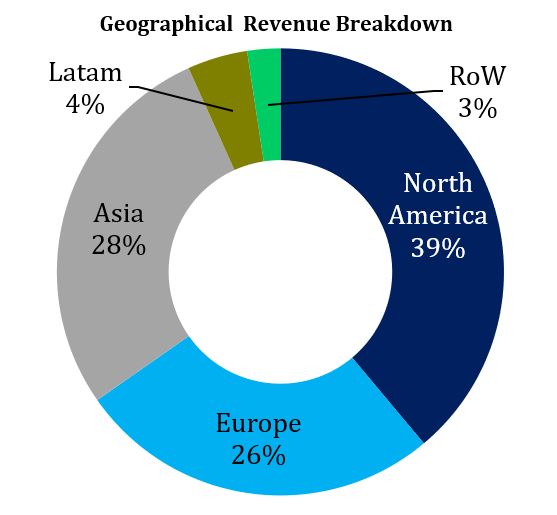 As can be seen in figures 3-5, whilst the Global Leader current portfolio displays the highest weighting towards Europe-domiciled companies, it is well diversified in revenue-generating activities on a sector and geography basis. This provides a diversity moat, shielding overall performance from idiosyncratic sector underperformance.
Diversification is also a key input for stock selection. Companies which prioritise operational diversity are less exposed to disruption within individual products, geographies or customer bases. One of the 6 core screening criteria for the Global Leaders’ portfolio is a company’s presence in multiple markets, ensuring a diverse operational footprint. How this diversification is achieved varies based on the business model.
For example, geographical diversity can be a core operational strategy. By producing goods and services in multiple markets, a company benefits from access to a broader variety of revenue sources.
As the largest global provider of IT services in the world, Accenture employs 721,000 professionals, serving 9,000 institutions across 200 cities, in 49 countries. This insulates it from income statement degradation if it was unable to continue serving one client, city or even country.
Accenture’s services, whilst fundamentally based around Information Technology, can be broken down into four core functions: Strategy & Consulting, Interactive, Technology and Operations. Moreover, this can be further broken into 24 -sub-functions, used to serve 19 different industries.
The theoretical loss of ,say, the US Federal government as a customer in its entirety would have to assume the cessation of demand for broad range of business services. This is not completely inconceivable for those that remember the demise of Arthur Andersen but we could well argue that all companies face constant reputation risk and whilst these can be moderated by culture and good board and sub-board controls, they can never be entirely eliminated.
We consider Accenture as having developed a diversity moat via a process of horizontal diversification. It has generated a competitive advantage by launching a plethora of related services, all of which offer individual utility functions.
Alternatively, an organisation may create a diversity moat by focusing on concentric diversification: producing new products or services, similar to the ones that are already sold, but servicing the market’s evolving needs with enhanced value propositions.
TSMC is the world’s most valuable and largest pure-play foundry company. It generates revenue by providing fabless semiconductor companies with outsourcing services for the manufacture of their designs. Moreover, whilst it is expanding its geographical presence into key geographies such as China and the USA, over 90% of TSMC’s operational capacity is concentrated within Taiwan. However, whilst it is not as geographically diversified within its operations as Accenture, it still achieves a similar level of diversification via a concentric strategy, which focuses on building the product’s utility functions and technical advantages.
TSMC dominates 53% of the global semiconductor foundry market. Moreover, it is one of only two companies which can produce the 5nm semiconductors required for leading-edge technologies, making it an essential player in every technology-driven industry. Geographical proximity has generated operational synergies by allowing technical employees to make trips to multiple locations in one day, enabling facility resource sharing and building up technical expertise in one area.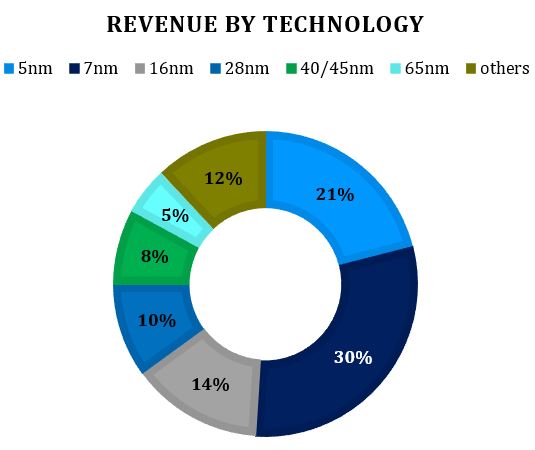 However, whilst concentrated in operational geography, TSMC’s revenues are not concentrated in one particular chip. In 2021 alone, TSMC deployed 291 distinct process technologies, manufacturing 12,301 products for 535 customers, of whom over 90% were based outside of Taiwan. TSMC predicts that 2/3rds of its revenue will be sourced from advanced technologies (7nm and below) in 2023. These chips are the most diverse in use case and provide the most technical advantages. For example, N28HPM, 16FFC and 10nm chips consume 1,264%, 218% and 155% more energy respectively, compared to the 5nm chips made by TSMC, providing key technological advantages to the devices which utilise these leading-edge technologies.
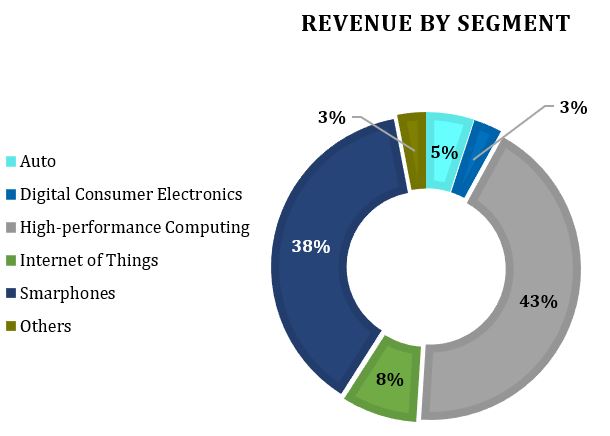 Due to the significance of the company within the global networking ecosystem, revenue generation per segment is roughly proportionate to the relative sector spend on networking technologies. Thus, Smartphones and high-performance computing account for significant portions of the TSMC revenue mix. However, significant disruption to those revenue streams would require a global acceptance of the technical devolution of these sectors, as they could not continue to progress without TSMC’s services. Through advancing the technical superiority and utility functions of their products, TSMC has become essential to global infrastructure, thereby generating a concentric diversity moat.
Ion Sioras & Oscar Mackereth
This piece is originally taken from the Cerno Global Leaders Investment Report Q3 2022, which can be read here.