


By FERGUS SHAW
& MICHAEL FLITTON
Stock markets are well known for exhibiting over-reactions and under-reactions. It is often the case that, on a medium-term basis, share prices overshoot fundamental value on optimism and undershoot on pessimism. The market and economic impact of this behaviour is magnified when the drivers migrate from company fundamentals to broad thematic trends and momentum exerts a gravitational force.
When this happens, whole sectors or other style groupings of companies move as homogenous blocks. Evidence of this occurrence is often identifiable in the valuation multiples placed on sectors, countries or size groupings of stocks and when such moves become extreme, historical experience suggests some form of rotation between loved and unloved areas of the stock market becomes more likely.
We currently observe that, within the equity class, there is a significant divergence on a number of measures and believe that the probability of rotation is sufficiently high to warrant portfolio action to take advantage of the opportunities presented.
A common approach to style analysis is to review the performance of value stocks versus growth stocks. The basis for this is that companies with higher valuations are expected to grow faster and the valuation takes into account rapid future earnings growth while value stocks have more pedestrian growth expectations and are priced more conservatively with the current assets and earnings of the company being more relevant.
Using long term data on the US stock market, the value style generally outperformed the growth style until 2006. The dotcom bubble was the one outlier when growth stocks maintained a prolonged period of outperformance. However, the growth style has been outperforming value on a rolling ten-year basis for a prolonged period of time as shown by the chart below from Bank of America using the Fama and French dataset.
US value vs growth, rolling 10-year annualised return

Source: BoA
There may be reasons for a change in the relationship between Value and Growth stocks, not least a change in the extent to which public markets are used by companies. If we continue with the categorisation and look at valuation rather than price on a global basis we can observe the valuation discount of value stocks moving to an extreme relative to growth stocks. This is shown in the following chart from Goldman Sachs which shows that over the last ten years, the valuation discount of value stocks to growth stocks for the MSCI All Country World Index has moved from -25% to close to -50%.
Value vs. Growth (Fwd PE Prem/Disc)
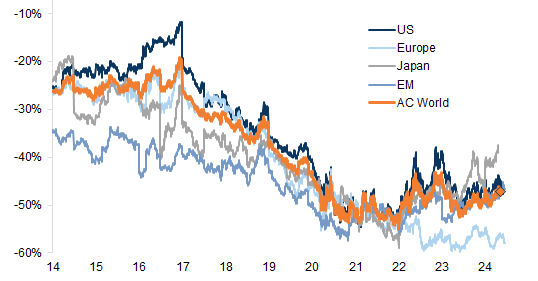
Source: GS
The nadir for Value on this basis came in 2022 and since then there has been some improvement. However, it remains clear that the valuation discrepancy between value stocks and growth stocks remains extreme. This tells us that earnings multiples being applied to growth companies are generous while value stocks are believed to offer little future growth potential. In other words, the optimism in growth companies is at risk of being overstated while the level of pessimism in value stocks suggests opportunity. History tells us to be alert for rotation when these relationships become extreme and the modest improvement since 2022 suggests some participants are taking action.
When listed companies become overly cheap, their corporate peers may be tempted to take advantage of incorrectly priced assets and engage in M&A activity. Any uptick in activity is likely to cause market participants to reassess pricing to favour companies seen as unduly cheap.
Global M&A Announced (US$bn, 3 months trailing)
 Source: Bloomberg
While this looks at M&A as a signal for some return to trend in the Value/Growth relationship, merger and acquisition activity has been promoted as a reason for some traditional relationships to change. In particular, the tendency of growth companies to stay private for longer and for acquisition rather than stock market listing becoming the prevalent exit route for Venture Capital in the US has resulted in smaller company indices missing out on high growth darlings that previously helped them outperform the large cap indices. The following chart from Bank Credit Analyst highlights this changed dynamic.
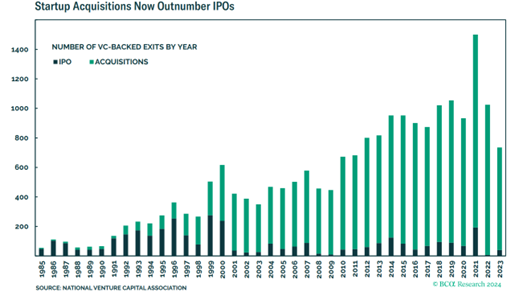
Of course, not all of these acquisitions are successful. When these failures occur on the public market, the company will fall out of the growth index (with a negative hit to the style index performance) and drop into a value index from whence it might rediscover its shine thereby delivering performance to the value index. We therefore see a reduced opportunity set of publicly listed companies that might help to explain some of the changed style cycle relationship. Indeed, a shrinking opportunity set of growth companies might cause the pool of capital on public markets to chase a smaller number of companies or sectors helping to explain style divergence. We can look to sectors for help in this analysis.
The Technology sector has always been a staple component of the growth style. The Tech sector today represents 33% of the S&P500 Index and 26% of the MSCI World Index. In both cases, Tech is the largest sector. Tech’s index weight has grown significantly.
S&P500 Sector Weighting of Technology (%)
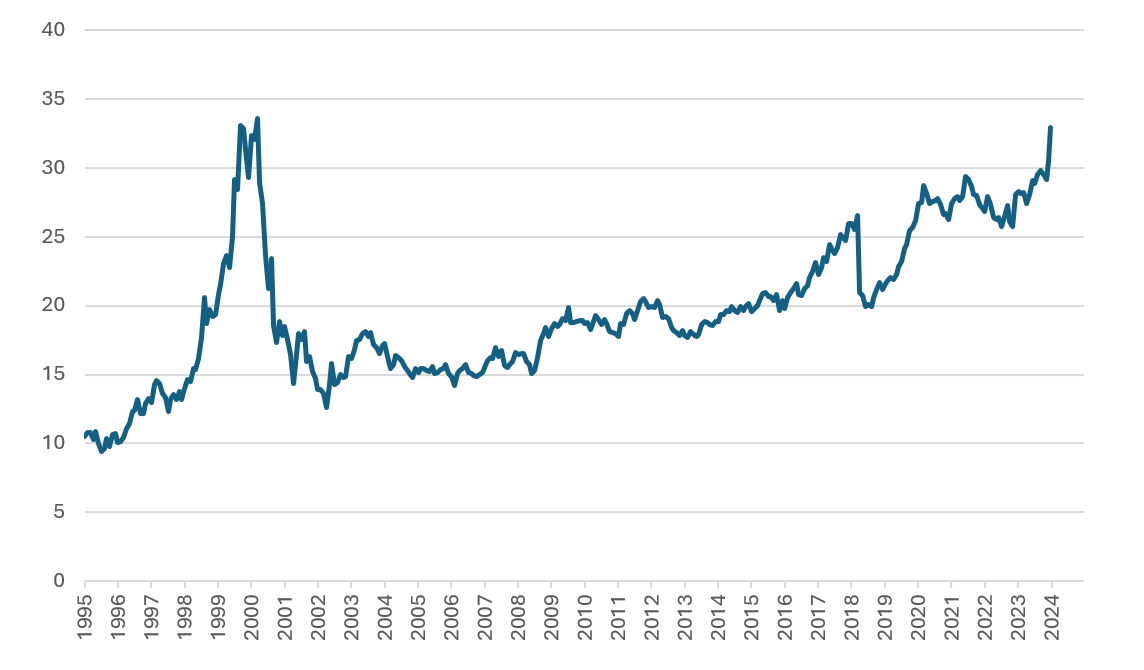
Source: Bloomberg
We can look at broad valuation metrics to reveal relative sector valuations. The following interquartile range chart from Goldman Sachs makes the current position clear.
MSCI World sector/style valuations (FWD PE vs last 10Y)
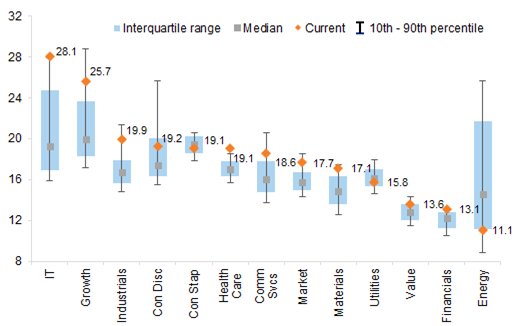
Source: GS
At 28 times earnings, the valuation of the Global Tech sector is currently trading at the most extreme level of dearness experienced over the last ten years. This filters through to a similar conclusion for the Growth style albeit not quite as extreme. Meanwhile, the current Value style multiple falls within the normal range and the Consumer Staples, Utilities and Energy sectors are the most unloved. It is tempting to draw comparisons with the dotcom bubble however, the mania for IPOs of unprofitable companies is not currently being repeated and the industrial sector remains well priced. The promotion of Artificial Intelligence as an investment theme is likely the most relevant in causing the recent surge in Technology company prices and history reminds us to be aware of the consequences of being overly exposed to thematic stories when their stars cease to be in the ascendency.
As is to be expected, the valuation of the US Equity market appears extreme on the same analysis given it is the home of many of the largest technology businesses. Meanwhile other areas show that valuation sits within normal ranges, in particular Japan and Europe. Within the latter, the UK on an 11.5x earnings multiple screens has particularly cheap versus history and relative to the rest of the world.
Valuation ranges (MSCI regions) over 20Y (FWD PE)

Source: GS
Thematic drivers have caused sector and style divergence that is sufficiently extreme to warrant modifications to equity allocations within multi-asset strategies. These can be viewed as opportunistic shifts to take advantage of price dislocations. Within Cerno multi-asset portfolios, allocations have been made on stylistic grounds to the Schroder Global Recovery Fund which carries an explicit value style bias. In addition, an allocation to the Lansdowne Developed Markets Fund delivers further value style correlation given the managers bottom-up research is highlighting deep discounts on valuation grounds for favoured stocks. Further, country allocations to the UK, Japan, and EM ex-China equity markets are also supported by valuation. These allocations in aggregate represent 33% of the TM Cerno Select Fund.