

By JAMES SPENCE

& FAY REN
This question is uppermost in investors’ minds as we have entered a period where inflation risks are high and rising.
It is both a question for the dedicated professional investor managing portfolios of financial assets and the private investor thinking about his or her mix of assets: typically, cash, property and equities.
Within the equity sphere, there are two key questions that derive from the larger enquiry. Are equities – as a class – better than bonds or bills or cash during periods of inflation? Secondly, if a selective or active approach is applied, what type of selectivity is helpful?
In this study, we have segmented the last 48 years in financial markets (back to 1972) to study performance of equities and cash against inflation during periods of relatively higher inflation. To simplify the study and to access the best quality data available we have proxied inflation as the US CPI rate and equities as the S&P500. As a good example of a selective approach to equities we have used data on approved companies within the Cerno Global Leaders Strategy.
There are 581 monthly data plots of US inflation between December 1972 and April 2021. The median monthly inflation rate over this period was 3.0%. We have selected periods within this range where monthly inflation was 3.0% or more as a rough delineation between low and high inflation.
As any casual student of modern financial history knows, the time span is, in effect, demarked by two inflation regimes. The first which ran from 1972 to early 1983 when inflation was “let out of the bag” by policies that prevailed in the US in the late 1960s and then exacerbated by various commodity shocks, principally around the oil complex, in the 1970s. The median US inflation rate between December 1972 and May 1983 was 8.2%.
That period came to end with the reign of Paul Volcker at the US Treasury, known affectionately as the “inflation slayer”. With a mix of hard policy actions, inflation was effectively better controlled from 1983. Affective policy action in the US was augmented by economic reforms and urbanisation in China and the rise of globalisation. The median inflation rate between June 1983 and April 2021 was just 2.6%.
There were 7 distinct periods between 1972 and the current year when inflation exceeded 3% for at least 10 months.
| Inflation period start | Inflation period end | Number of months | Average inflation rate |
| Dec 72 | May 83 | 125 | 8.5% |
| Nov 83 | Feb 86 | 28 | 3.9% |
| Apr 87 | May 93 | 74 | 4.2% |
| Feb 00 | Jun 01 | 17 | 3.4% |
| Jun 04 | Aug 06 | 23 | 3.5% |
| Oct 07 | Oct 08 | 13 | 4.4% |
| Apr 11 | Jan 12 | 10 | 3.4% |
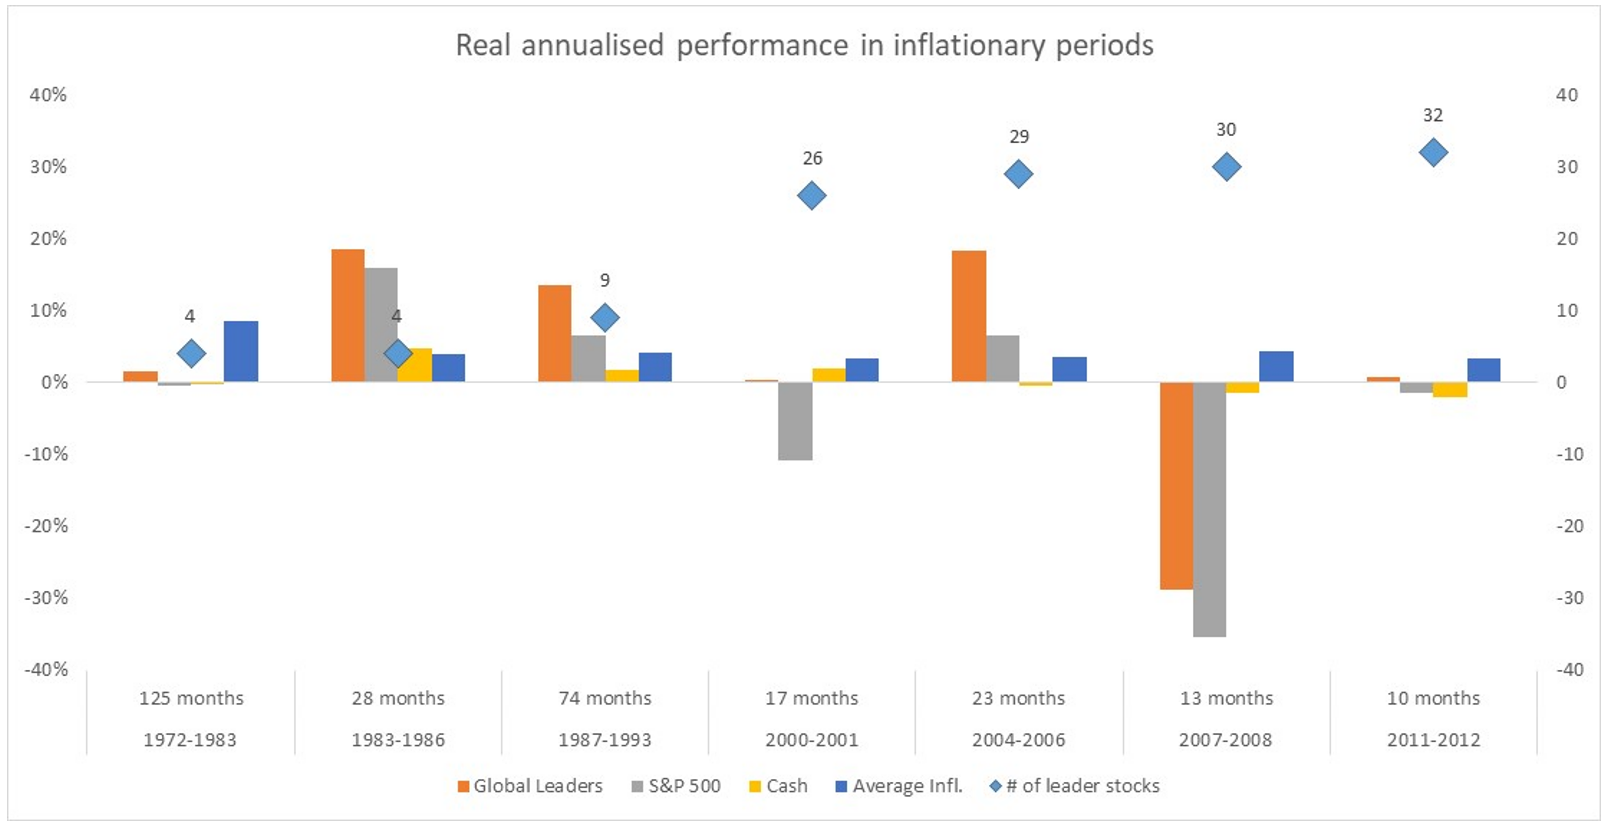
Only 4 Global Leaders Strategy constituent stocks were listed in the first two periods under consideration: Johnson & Johnson, PPG Industries, Philips and Fedex. This increases to 9 in the 1990s, 26 by 2001 and 29 by 2006.
Given the shortage of a full data set, due to included companies not being listed in the past, interpretation of the data should be handled with some caution.
For those 7 periods, we capture below the after inflation returns for the S&P index and an equally weighted portfolio of those Global Leaders which were listed at the time.
| Inflation period | S&P return (nominal/real) | Global Leaders return (nominal/real) | Global Leaders vs S&P 500 annualised (+ve represents outperformance) | Number of listed & approved Global Leaders Companies |
| 1) 72-83 | 8.1%/(0.4%) | 10.3/1.6% | +2.2% | 4 |
| 2) 83-86 | 20.2%/16.0% | 22.9%/18.6% | +2.7% | 4 |
| 3) 87-93 | 10.9%/6.5% | 18.4%/13.7% | +7.5% | 9 |
| 4) 00-01 | (7.7%)/(10.8%) | 3.8%/0.3% | +11.5% | 26 |
| 5) 04-06 | 10.6%/6.5% | 22.8/18.4% | +12.2% | 29 |
| 6) 07-08 | (32.9%)/(35.3%) | (26.0%)/(28.7%) | +6.9% | 30 |
| 7) 11-12 | 0.7%/(1.4%) | 3.0%/0.8% | +2.3% | 32 |
We add cash, proxied by 30 day US T bills to the mix so we can compare broad and selective equities against cash during periods of inflation.
 Interpretation
As to whether there is something intrinsically in the mix with respect to broad or selected equities and inflation protection, we offer the following observations, first on the broad asset class and then on those within the Global Leaders Strategy.
Broad Equities
1). With respect to broad equities, much hinges of whether they are truly “real” assets as they have been traditionally regarded. Real is defined as having a direct and positive relationship with inflation. This definition to our minds is flattens the detail as the true picture is mixed by sector and company. Some companies have low margins and high labour and materials input and some companies have the reverse. Others lie between.
2). It also matters which costs are inflating. Inflation can be a broad phenomenon, as say during a currency crisis such as Indonesia in 1997, Zimbabwe in 2007 and Venezuela in 2016 or more narrowly confined to a key commodity class: oil in the 1970s or even pork in China in 2020.
3). For the purposes of this study, we have set 3% annualised inflation as the mark above which we have studied the putative impact of inflation. Some of these periods were long, others less so. The length of a period of inflation and its degree of embededness has some bearing on economic and market effects. Not all inflationary periods are the same.
4). There are some reasons to suggest that that developed market equities may possess some edge over emerging market equities due to traditionally higher weighting toward services and corresponding lower raw material inputs. This may have been true but is unlikely to be sustained as the technological advancement of North Asia and rapid growth of internal consumption in these economies acts to erode these differences.
Global Leaders Equities
1). This study, which is partial, provides prima facie evidence that a selected portfolio (if a certain mix of factors are incorporated) could and should do better than a broad index.
2). What are the factors within the Global Leaders Strategy that are helpful with regard to inflation protection? We suggest the following:-
i). Higher than average margins
ii). More defensible economic moats
iii). Supported by positive industry structure dynamics that favour established players
iv). Operating in largely rational market places
v). Protected by well commercialised and enforceable intellectual property
vi). High degree of value added in their operations
3). It should also be considered that a degree, perhaps a large degree, of survivor bias helps with these results. The stocks in question were strategy constituents as at mid-2021. A company in the strategy in 2021 that also existed in 1972 (on 1980 or 1990) is clearly a survivor.
4). Point (3) is conceded and should be considered alongside the possibility that the individual dynamics of individual companies (the “winner factor”) trump all other considerations, including macro considerations such as inflation.
Conclusion
If the last point made is true then inflation protection, to whatever degree, is a function of stock price performance beating the inflation rate, then all is well and good. It would be unreasonable to expect a portfolio of stocks to exhibit a mechanical connection to inflation: the factors are various and not consistent over time. So, if inflation protection turns out to be one of the outcomes from applying a screening strategy to pick stocks, then this can be a benefit to investors.