
By JAMES SPENCE
Cobras in the Basket: Bonds, their curves, their relationship with equities and market tops
In the last two months, we have seen a meaningful rise in bond yields. Key maturities in the US curve have crept up. The 2Y US Treasuries now stand at 2.15%, the 5s (5 years maturity) have moved up to 2.53% and the 10s to 2.73%. This has not been accompanied by any visible change in central bank policy or rhetoric. It is our belief that investors should take heed and begin to adjust their portfolios, if they have not already done so. This is not the first time in the post crisis period (a period that will soon be 10 years long) that bond yields
have fluttered.
During the so called “taper tantrum” that occurred between February 2013 and January 2014, those same maturities ran up considerably: 5s went from 0.63% to 1.86% and 10s 1.62% to 2.80%. There were other noticeable sell offs after the post 2008 low. The 10s moved from 2.0% points in early 2009 only to crest at 4.0% in 2010.
As we can see, in those previous periods, yields then proceeded down, with the curve compressing to new lows. Why might we think and react differently on this occasion?
Why would we think differently about markets’ development now?
The principal reason is that we have entered an unusual period of synchronised global growth in which the world’s major economic regions are enjoying an upswing. JP Morgan’s cross asset team have recently described this as being “the strongest, broadest economic expansion in seven years”. This is both observable and uncontroversial and contrasts, atmospherically speaking, with the considerable doubts that have accompanied much of the current cycle. For many have mistrusted the cycle and some have called its end, repeatedly and prematurely. Others are ideologically opposed to the tools used to secure the recovery, principally Quantitative Easing (QE) and Zero Interest Rate Policy (ZIRP). We know of one experienced
manager, for example, who has termed these “meddling with nature”.
The unfurling of growth creates a tension in the pricing of bonds, during a time where QE is still in force in the US, Europe and Japan. But for the presence of QE, it would be normal to expect longer term bonds to meet the recovery with higher yields: the so called normal curve where longer dated paper imparts higher yields than short dated paper. The move from a flat curve to a normal curve is termed bear steepening: higher yields meaning correspondingly lower capital values (lower asset prices). This is now happening even with QE programmes still operational.
Bonds are relevant but how?
For many investors, especially those for whom equities have long been the preferred asset class, bond markets are somewhat of a mystery: clearly relevant but how?
Well-groomed fundamental analysts who spend their time assessing the value of listed equities for the most part use bond yields as a component of their discount rate. A bond yield, normally the 10Y US Treasury, is included in the discount rate. Norges Bank Investment Management, who manage over US$1tn in assets on behalf of the Norwegian people and employ a fundamental approach use, for example, a fully built-up discount rate of 2.6% when assessing fair value.
All courses in financial analysis require their students to understand and apply the Capital Asset Pricing Model (CAPM) under which the cost of equity used to discount back cash flows uses the following formula.
It runs as follows:
Cost of equity (i.e. the discount rate) = Risk Free Rate + Beta (Market Rate of Return – Risk Free Rate of Return).
Note that the Risk Free Rate (RfR) appears twice in this formula.
In the age of QE, the yield on the 10Y Treasury (most analysts use this number for the RfR) has been compressed. This is the aim of the policy. The avowed intent of QE being to push bond yields down, keep in the Alice in Wonderland world of modern times, the Risk Free Rate is, to our minds, anything but risk free. We would argue that it harbours plenty of risk, especially in a phase of synchronous global economic growth. This is not to suggest that the US government, or any other developed market issuer, is likely to default but that capital losses are very possible, even for long term holders and also for holders to maturity. For it is written on the face of a bond that it will repay the nominal value. If you buy a bond in the market
priced at US$105, it will deliver a capital loss if held to redemption (US$100 being par and the redemption price of a bond).
Inflation plays a role
The other relevant fundamental factor in the pricing of bonds and their theoretical (or possibly more spiritual) connection with equities, especially that commuted by inflation and inflation expectations. Inflation is ruinous for bonds as they are nominal assets whose cash flows do not change as inflation rises. Higher inflation is typically met with higher bond yields (through the open market function) and correspondingly lower capital values.
The response of equities is more nuanced. Over short to medium time frames, anxieties about companies’ abilities to pass on inflation effects to their customers creates fluctuations in equity values. Also, there is reason to believe from empirical evidence that inflation has a bearing on market price earnings (PE) ratios: higher inflation depressing the PE. The good news for truly long-term investors is that the equities of leading companies are able to sustain their fundamental value as businesses through periods of inflation.
It is our view that all the conditions precedent for a rise in inflation are in place, even if this is not a large change and even if hyperinflation remains a very low probability event. Whilst labour’s demands for wage rises have been quiescent to date, many key labour markets (US, Germany, Japan) are experiencing technical full employment.
Strong growth accompanied by rising inflation, even if only modest, is a toxic cocktail for bonds. Are then inflation linked bonds a good asset to own in this environment?
Inflation linked bonds unlikely to prosper
We have concluded not. Inflation liked bonds (ILBs) are not real assets, they are nominal assets. This is despite the fact that their principal and thus coupons are indexed to inflation. When you relate ILBs to other financial assets they most resemble nominal (unlinked) bonds and the performance of nominal bonds best explains their performance over time.
Looking back over the past 10 years, somewhat paradoxically, it is the absence of meaningful inflation and the consequent ride down in yields of conventional bonds that have carried their linked cousins with them.
The other environment in which linkers work well is when you have rising measured inflation (it needs to be in the index to adjust the cashflows of the bonds) but the Central Bank response and the movement the curve (curve being described by joining the dots on all the traded maturities longer than short term LIBOR) is mute. We think that that combination of outcomes, on a balance of probabilities basis, is unlikely – a judgement that appears to be supported by the recent movement of bond yields in response to synchronous growth as mentioned above.
We have now sold all inflation linked bonds across all portfolios, having previously cut holdings in July 2017, with these thoughts in mind.
In their place, we have invested in short dated Floating Rate Notes: credit instruments issued by companies and banks on which the rate of interest flexes, very short dated fixed rate corporate paper and a curve steepening expression.
The latter is structured so that portfolios will benefit when longer dated rates rise faster than short dated rates: this is a logical expectation should current growth conditions be maintained. Critical to the supporting analysis is the observation that the start point for the curve steepener is from an extremely flat position. Bond market professionals use the difference between the yield on 10s versus that on 2s paper as a shorthand way of describing flatness versus steepness. In the past 5 years, in the US Treasury market, these are as low as 50 basis points (bp or basis points being one hundredth of a percentage point) and as high as 250bps. Our point of entry in a Eurodollar spread of roughly equivalent behaviour to 2s10s is 20 bps.
We have sympathy for related ideas as applied to German bunds and Japanese government bonds.
A sharp steepening is disruptive to other tradeable financial asset classes on the fear factor alone. Sentiment can easily change, from the general belief that central banks have bonds charmed, like cobras dozing in a basket, to something much more threatening.
Portfolio actions
We observe several coincident signs that key asset classes are approaching market tops. These are i) economic in terms of synchronised economic growth and rising inflation ii) fundamental in terms of high valuations iii) technical in terms of chart developments iv) sectorial in terms of which industry sectors are exhibiting relative price outperformance v) policy driven in respect of rising interest rates and vi) sentiment which has become very positive on some gauges. Indeed, bonds may already have topped. Whilst the timing of this is never an exact science – as late cycles are often accompanied by upward parabolic moves and numerous assaults on highs (double tops, triple tops) – as our approach is to think about the medium to long term in a probabilistic sense, we have altered some key asset allocations and have introduced new positions to the
portfolio.
Key portfolio changes
1) All Index Linked Bonds have been sold
Index Linked Bonds work in some scenarios but not all. A bond bear market in nominal (unlinked bonds) will power a bear market in index linked bonds. This is simply the flip side of the bull markets that both asset classes have enjoyed.
2) A yield steepener has been added to portfolios
Portfolios will make money if longer dated rates rise quicker than shorter dated rates. This normalisation of the curve is a consequence of the withdrawal of Central Bank QE programmes and a conventional response to higher inflation.
3) Put option protection has been added
A quarter of the NAV of the portfolio is hedged via put options on the S&P index. This terminal hedge amounts to 40% of equity weight, giving an adjusted equity weight of 36%. This is one half of the exposure we were running two years ago when equity allocation peaked at 72%.
4) Defensive assets now amount to 30%
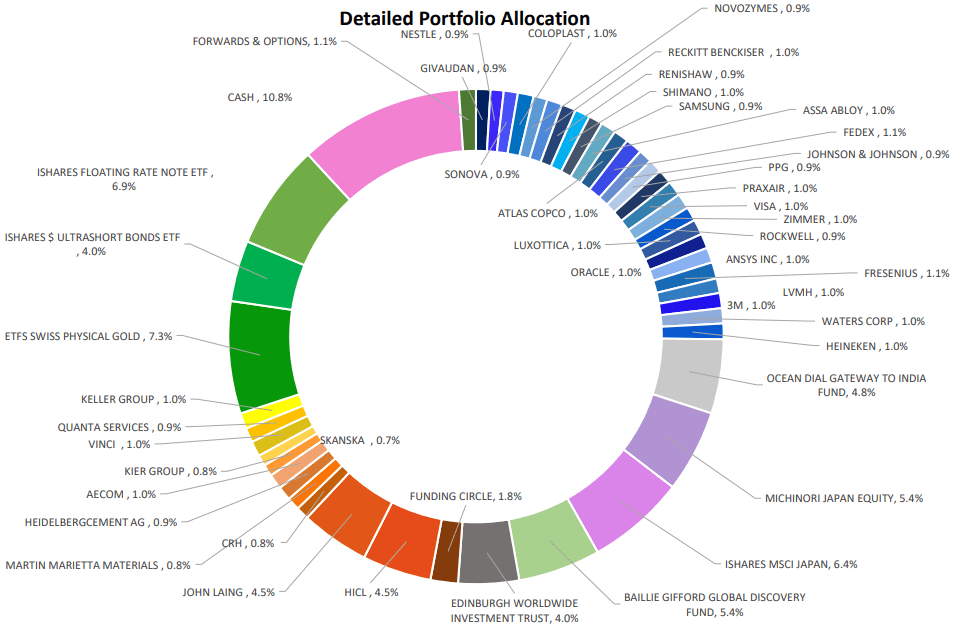
The aggregate of cash, gold and very short dated debt securities. Japanese yen is now half hedged. The Cerno multi asset style is to look to participate in good markets in a well-diversified manner but be protective of capital during serious downturns. We caption the multi asset portfolio below.